A comprehensive Analysis on American lifestyle and mortality
This is my first project at University of Chicago – Data Understanding and Preparation program. The idea is to take any descent sized dataset ( with records more than 50,000) and draw meaningful insights. Hence, this would be a open ended challenge. However to start with an idea, I was always curious which deceases have greater impacts on human lives. This introduced the information recorded by Centers for Disease Control and Prevention – National Center for Health Statistics.
Introduction to the Datasets
One Dataset corresponds to the Mortality and Disease, the other show correspond to the population/ census. Hence, we have pulled the census data from www.census.gov. Note that our analysis is between the period 2015 to 2017.
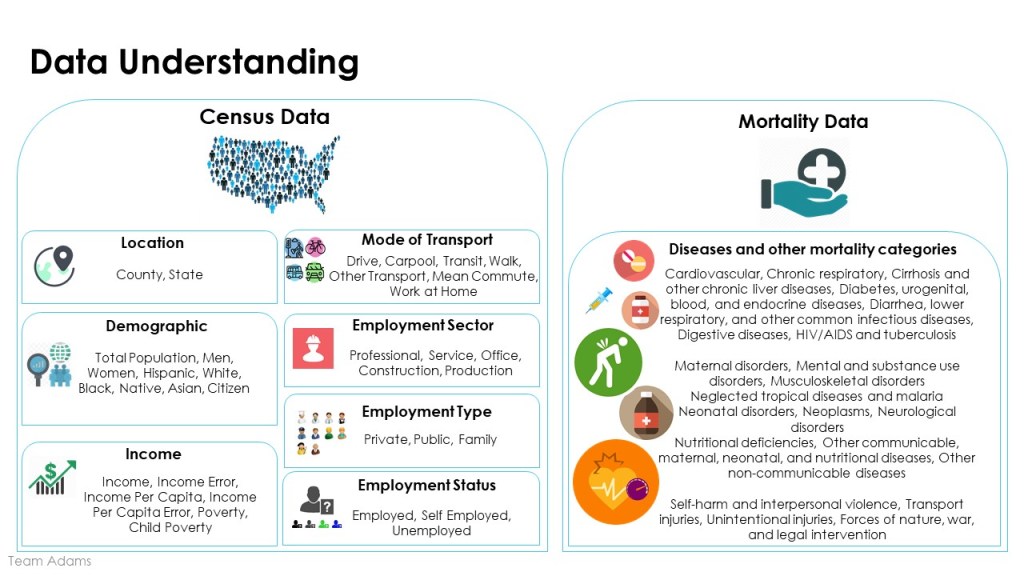
- Census Data: This includes the county level based information of men and women with their Income, Employment Status, Type, Sector, Mode of Transport to their work, etc. The dataset also gives information on Demographics of counties.
- Mortality Data: Different types of diseases and deaths recorded with it.
For the analysis, I’ve considered MySQL. Its simple, quick to draw insights and easy to code. I have also created dashboards on Tableau and PowerBI. I will be creating a new post dedicated on creating visualization.
The first step in using a structured query language like MySQL is understanding the Dataset(s) and relationship between them. In MySQL, we have a feature ‘Entity Relationship Diagram (EER)’ which gives a visual meaning to it.
The EER feature assumes you to have datasets in a normalized form. Normalizing a database essentially follows a set of rules. Below are the set of rules. You can download the Normalized Database tables here : UC_Normalization.pdf
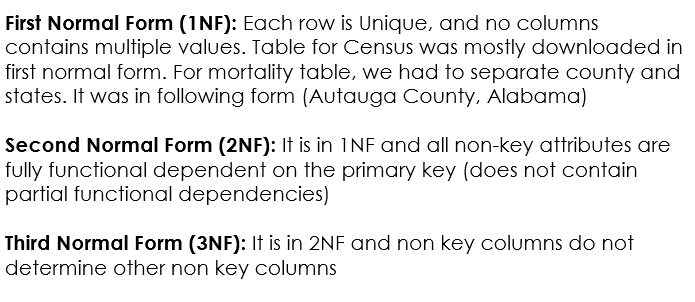
Once you have the number of tables decided by following Normalization rules, go to the the EER section of MySQL and build them. While creating the diagram, you will have to assign primary and foreign key in a table.
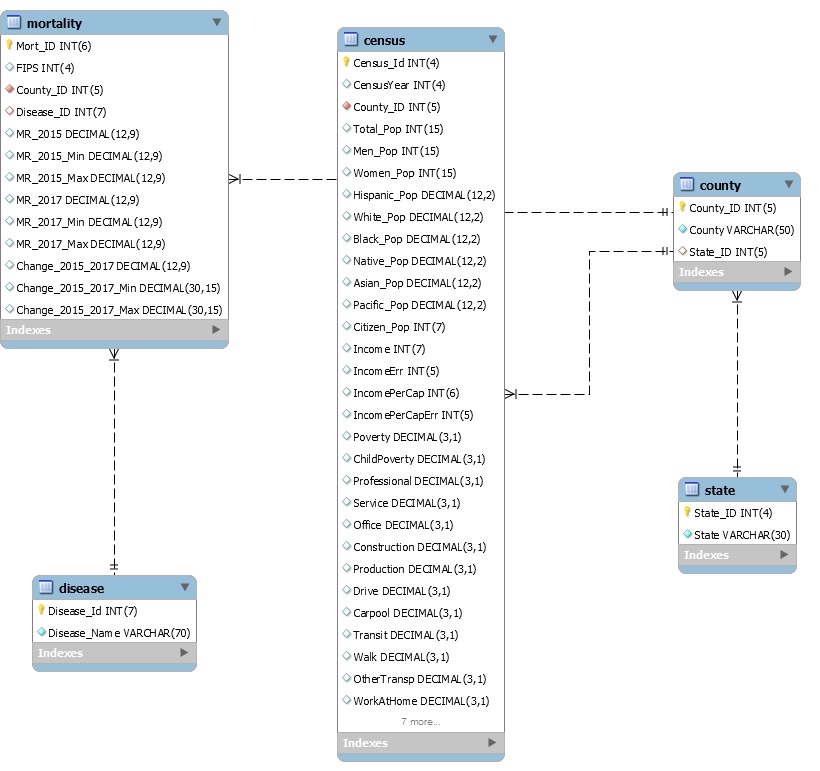
The biggest challenge was while cleaning the data. As you can see from the above EER diagram, County_ID is the primary and foreign key that binds Census and Mortality data. Hence, it needs to be unique. However, USA has a lot of same named Counties. We had to consolidate counties from a state and represent them uniquely with the other.
We had to do missing value treatments, whitespace removal in our data cleaning step.
Data Analysis
This is my favorite part in the process. Now that we have cleaned datasets in csv format, we can start off by creating a new project and creating a MySQL database. I do not wish to stretch the post by adding my code here. However, please feel free to access it on my GitHub.
- In 2017, Oglala Lakota County records the highest deaths due to Diabetes(across USA) having the least per capita income(across South Dakota) with half the population under poverty and majority working for public sector
- In 2017, People in Franklin Parish, Louisiana saw the highest cardiovascular deaths. Interesting to note that nearby counties have similar mortality rate. East Carroll Parish, has the least per capita income in the same state
- In the year 2017, Fallon from Montana has the greatest number of deaths due to ‘Nutritional deficiencies’ with 170 people more susceptible to the disease because of poverty
- Women in Macon, Illinois have seen highest increase in Maternal disorders with around 10.5k women are under poverty
- Los Angles from California is the most welcoming place in USA for opportunity seekers across the globe
- Mississippi has highest deaths due to Cardiovascular disease and lowest per capita income. Probably their lifestyle due to low income might have forced them to rely on low priced food/ junk food.
Here is a presentation that summaries this project. You can find all the relevant materials with Tableau Dashboards on my GitHub
