A BIG Eye on Indian Finance Minsters’
Finance Ministers’ of 21st century are more influential than the Defense Ministers’! At least in case of India. Every move FMs’ office makes in budgeting, policy making, grants, etc. directly shapes the economy.
An individual can see a direct and indirect impact by FMs’ decisions. What if you are an venture capitalist/ looking to expand your business? Do you like relying only on promises and work your luck on it? How about being informed well in advance to pioneer in a new field?
This is a very complex and convoluted space to understand. There are a tons of reasons which influence finance budgeting and political wills around it. However, what if the budgets really improve a sector and you miss out on it? On a different perspective, you could be a critic and help governments on whats’ lacking!
This project is an attempt to analyse a Finance Minister’s promise and validate if that has fueled any growth. The best way is to analyse is through ‘well thought Budget Speeches’ that document every initiative/ policy that is intended to target a specific sector.
We’ve considered a decade long history of Finance Ministers’ speeches and corresponding GDP figures across prime sectors.
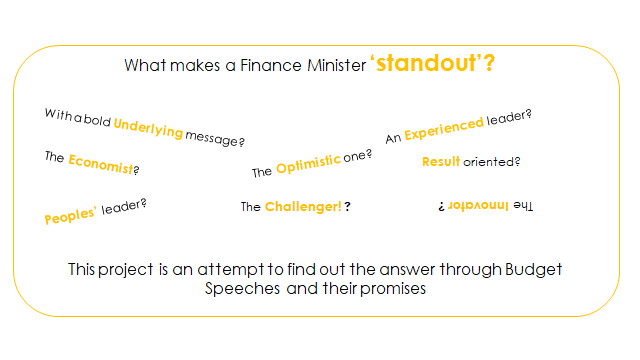
The First Question
As one can guess, what makes a Finance Minister standout from the rest? When do we call a FM successful? The following are the questions that come to my mind.
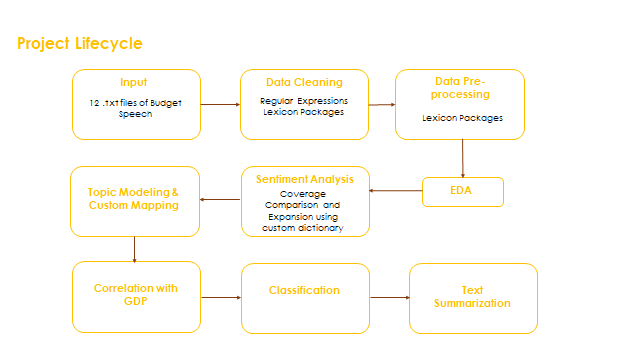
Lets get our hands dirty by understanding the data. To better understand the flow, below is the Project Lifecycle
Data Cleaning
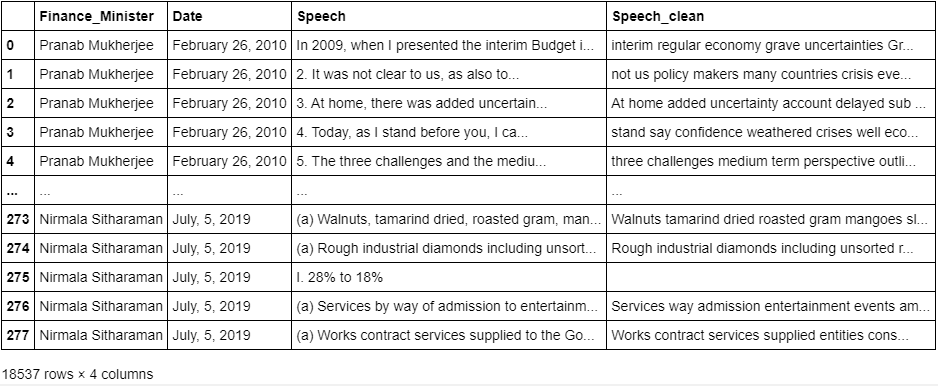
Imported 2010 to 2020 speeches which include 13 speeches (2 interim speeches). We have received the speeches in a .txt format from the company we are working with. We have imported all the speeches in a pandas DataFrame. Each record corresponds to each sentence of the speech. This is how it looks like:
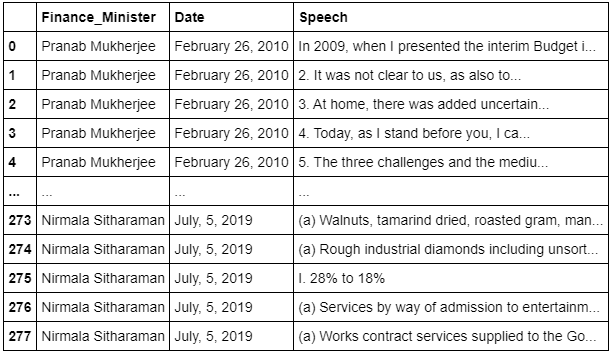
As you can see we have imported from 2010 to 2019. We will be using the latest 2020 speech as a test data to predict our understanding from previous years.
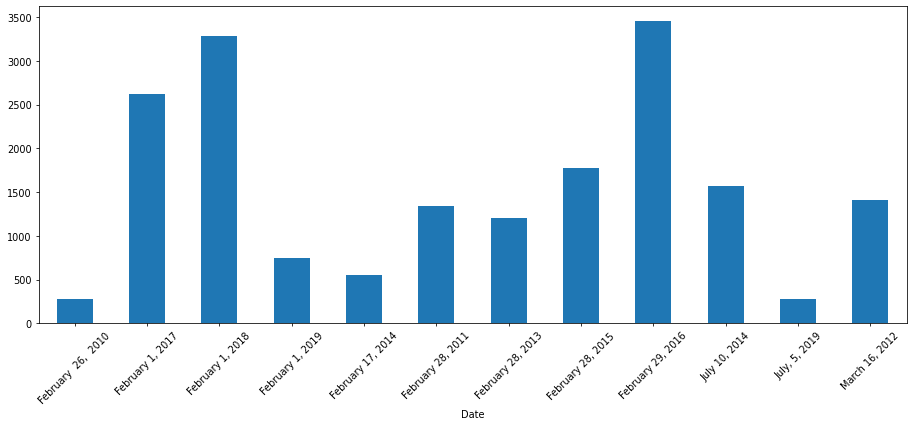
By using simple groupby statements, we can find the total number of sentences for each speaker/ FM. Please note that the order doesn’t follow chronology.
As a first process of cleaning, we will have to remove un-necessary words like digits, dates, special characters, Non alphabetic, websites, white spaces, etc. For removal of stopwords, we have used simple NLTK package. We have defined custom dictionary with added stopwords that we have observed in the EDA process. (Back and forth process to fine tune)
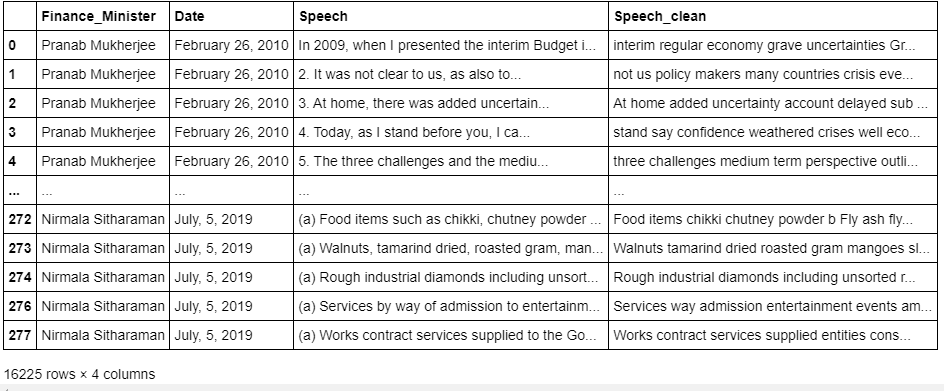
Using regular expressions, we have cleaned the speech data and have a new column ‘Speech_clean’.
As we could see there are a few empty records that previously had unwanted characters. Hence, getting rid of them. The final DataFrame looks like this:
Exploratory Data Analysis
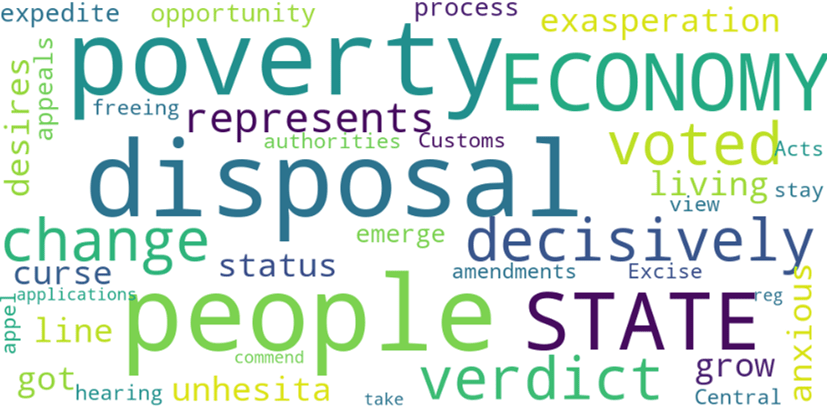
There is no better way to check text other than building a word cloud. Here is a sample word cloud for Arun Jaitley’s 2014 speech.
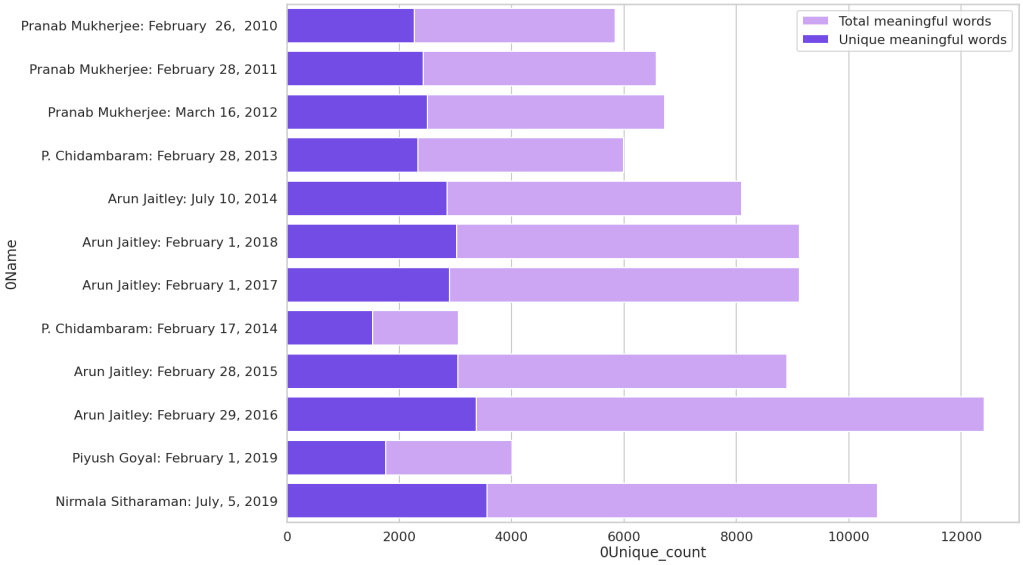
I wanted to check how many unique words do each FM had in their speeches. Here is the bar graph which shows ‘unique words’ in comparison with other meaningful words.
In addition, what kind of words are the most occurring ones here? For instance, In Nirmala Sitaraman’s speech – 2019, we had the following graph. We can see words like ‘section, government, scheme, tax, crore, provide, income’ on the list.
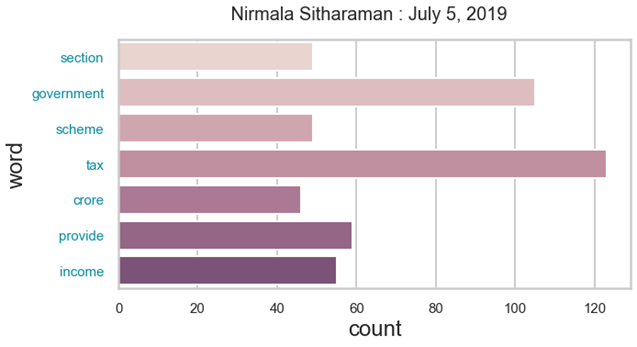
A quick look at this graph shows that words are very generic and is of not much use. Hence, we need to further clean and understand the data.
There are a lot of additional EDA steps conducted that can be referred on my Github
Sentiment Analysis
Each sentence of a speech is calibrated with Sentiment Analysis scores (positive, neutral, negative) using packages like VADAR, NLTK, AFINN, TextBlob. As TextBlob is more like a wrapped NLTK, I have chosen TextBlob among both.
Before we check coverage(number of sentences in a speech that has sentiment polarity in the package), lets see how the sentiment values change with the progress of speech.
For instance, consider Pranab Mukharjee’s 2010 speech. Following are the sentiment footprints captured through TextBlob.
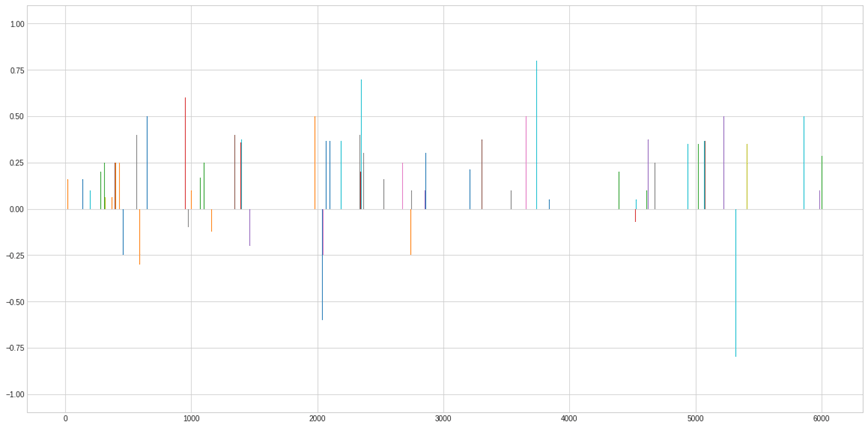
A couple of important observations from this graph:
- There are more positive words than the negative ones
- Gaps between any two consecutive lines are the neutral values
- Clear representation that the number of words covered by are very sparse compared to the total number of words in the speech. Lets check if its true with other packages as well.
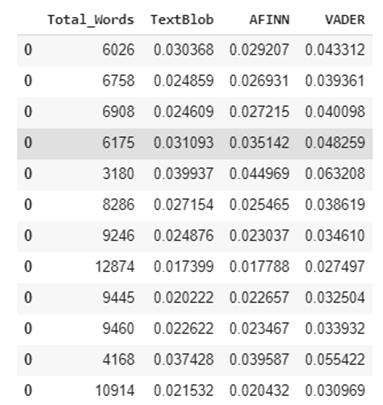
From the above table, we can see VADAR to have better coverage overall. However, its important to check the words that are very important contextually and have no polarity to it. These words needs to have an assigned polarity.
To check such words in each speech, consider pulling words that are most commonly occurring ( we’ve considered more than twice) and have no polarity. We have assigned polarity between -1 and 1 for such kind of words to create our own custom dictionary. This mostly includes all the finance related words.
to be updated shortly. . .
